Overview
The Pivot Grid is a dynamic reporting tool in serviceminder that allows you to interactively analyze, filter, and group data. It's especially helpful for identifying trends and comparing key business metrics, such as:
- Repeat Revenue vs. Initial Revenue, year over year
- Proposal Values across campaigns and time periods
Settings and Navigation
In the Reports section, you will find a Proposal Pivot Grid and a Revenue Pivot Grid.

Using a Pivot Grid
The interface is divided into four key areas that determine how your data is displayed:
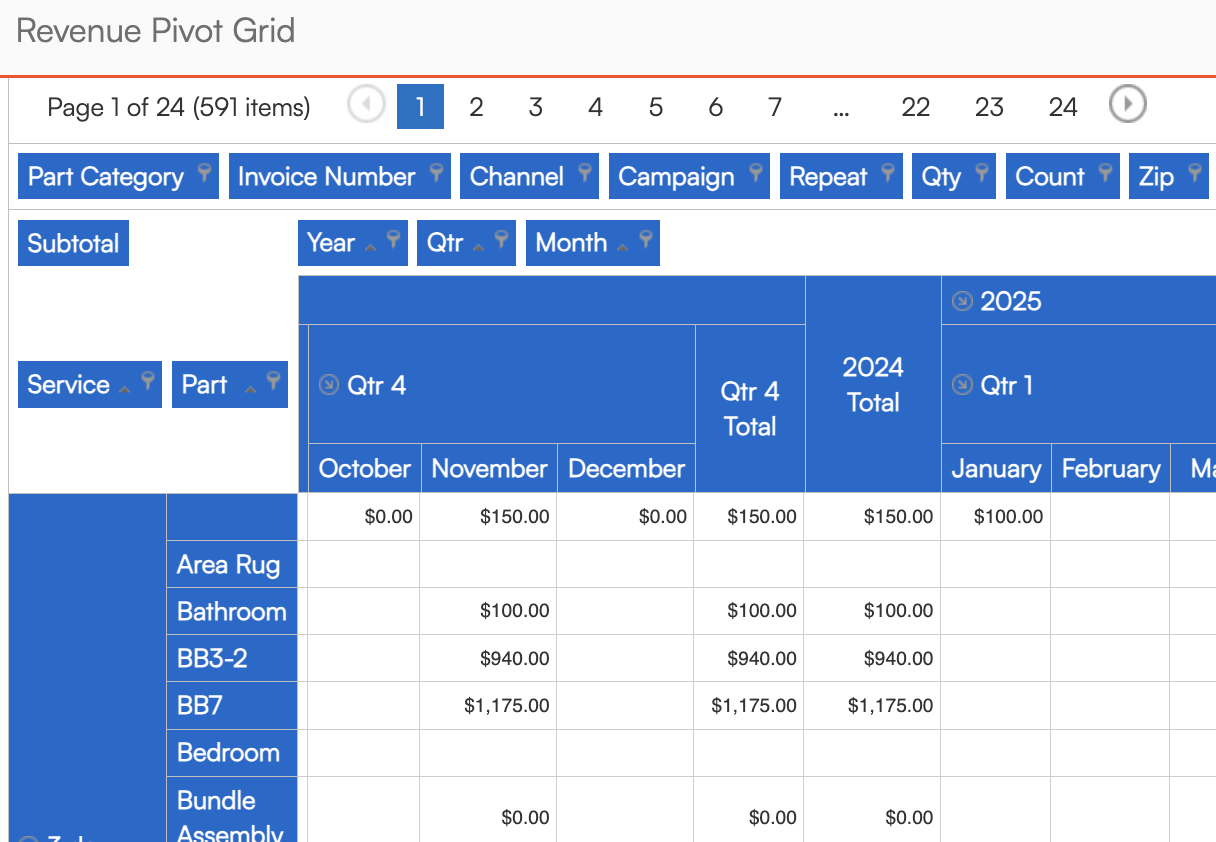
1. Filter Header Area
Located at the top, this section is where you can drag field headers to control how your data is grouped into rows or columns.
- To create a column group, drag a field to the Column Headers section.
- To create a row group, drag a field to the Row Headers section.
- You can also remove groupings by dragging fields back up to the Filter Header Area.
2. Column Header Area
This section defines the columns of your grid. The fields placed here determine how data is grouped and displayed horizontally.
3. Data Header Area
Found adjacent to the column headers, this area contains the summarized values—such as totals or counts—you want to analyze. Typically, each Pivot Grid offers:
- A line-level header (e.g., invoice line items)
- A document-level header (e.g., the invoice or proposal itself)
Choose one depending on the level of detail you need. Using both may result in duplicated data if not configured carefully.
4. Row Header Area
This section determines how your data is grouped vertically. Common use cases include:
- Grouping by Service
- Grouping by Part
Both fields are included by default. If you only want one, simply drag the other to the Filter Header Area to exclude it.
FAQs
Q: What’s the difference between line-level and document-level data headers?
A: Line-level headers show individual service or part items within a document. Document-level headers summarize entire proposals or invoices. Use one or the other depending on the level of detail you need.
Q: Can I save my custom Pivot Grid layout?
A: Yes! After customizing your grid, scroll down and save it as a View. You can also mark it as a Shortcut so it appears in your sidebar for quick access.
Q: Why is my data repeating or duplicating?
A: This usually happens when both line-level and document-level headers are used together. Choose one based on whether you want detailed or summarized data.
Q: Can I export Pivot Grid results?
A: Absolutely. Use the download icon to export your current view to Excel for further analysis or sharing.
Q: Are Pivot Grids available on the mobile app?
A: No. Pivot Grids are available only in the desktop interface.
