Overview
In other words, these reports will only pull data from the location you are logged into.
This article will review:
Settings and Navigation
Go to the navigation menu and click on Reports. You will see three tabs:
- Reports shows all possible org-level reporting.
- Charts provide a visual representation of data.
- Downloads allows for massive data pulls for your location.

You may also see a tab called Insights, if your brand has that feature included in your plan.
Contact Details Report
The Contact Details report provides a comprehensive overview of all contacts (clients/customers) within your organization. It lists all contacts in your system and gives a simplified view compared to the full contacts grid, focusing on key information for each contact.
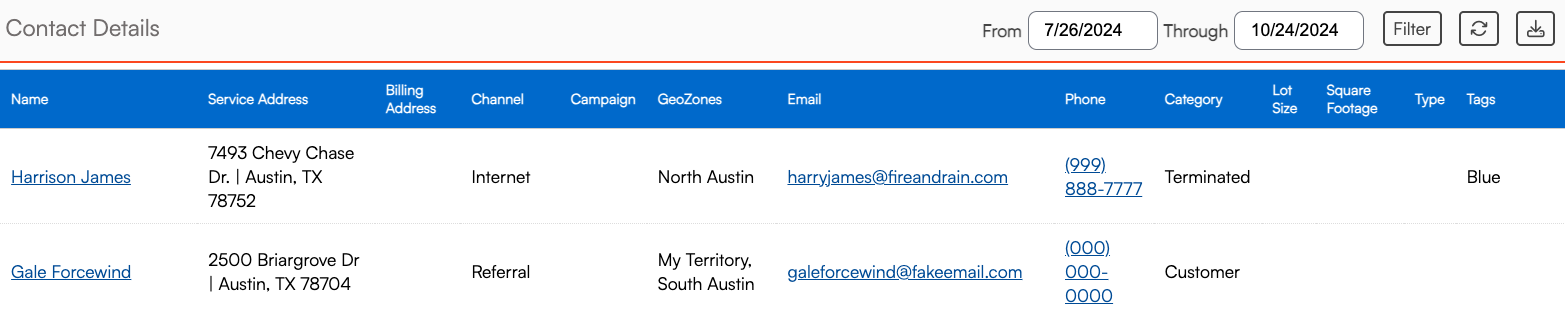
You can filter this list by date range, Contact Owner, categories, tags, and more. You can also download the Contact Details list.
If you add filters or change the date range, don't forget to refresh to have the page update and reload. Look for the button with the two rotating arrows.
Referral Report
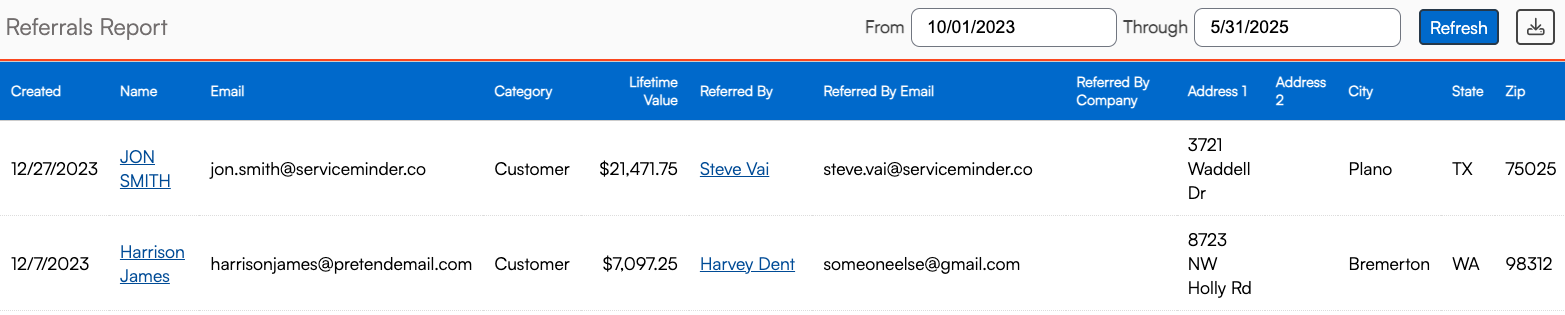
The Referrals report tracks and analyzes contacts who were referred by other contacts within your system. It shows all contacts that have been referred by other contacts within a set date range, basic contact details, who they were referred by, as well as the referred contact's lifetime value.
Referrals by Invoice Report
The Referrals by Invoice report adds invoice-specific details, showing the financial value generated by each referral.
Duplicates Report
The Duplicates report is essential for identifying and resolving duplicate contact records, supporting data integrity, operational efficiency, and a better customer experience. It scans your contact database and identifies contacts that may have been added more than once, highlighting potential duplicates based on key fields such as name, email, phone number, service address, and company.
Pipeline Report
The Pipeline report is a central, visual tool for tracking the flow of leads, appointments, proposals, and conversions in your business, making it essential for sales management, forecasting, and operational efficiency.
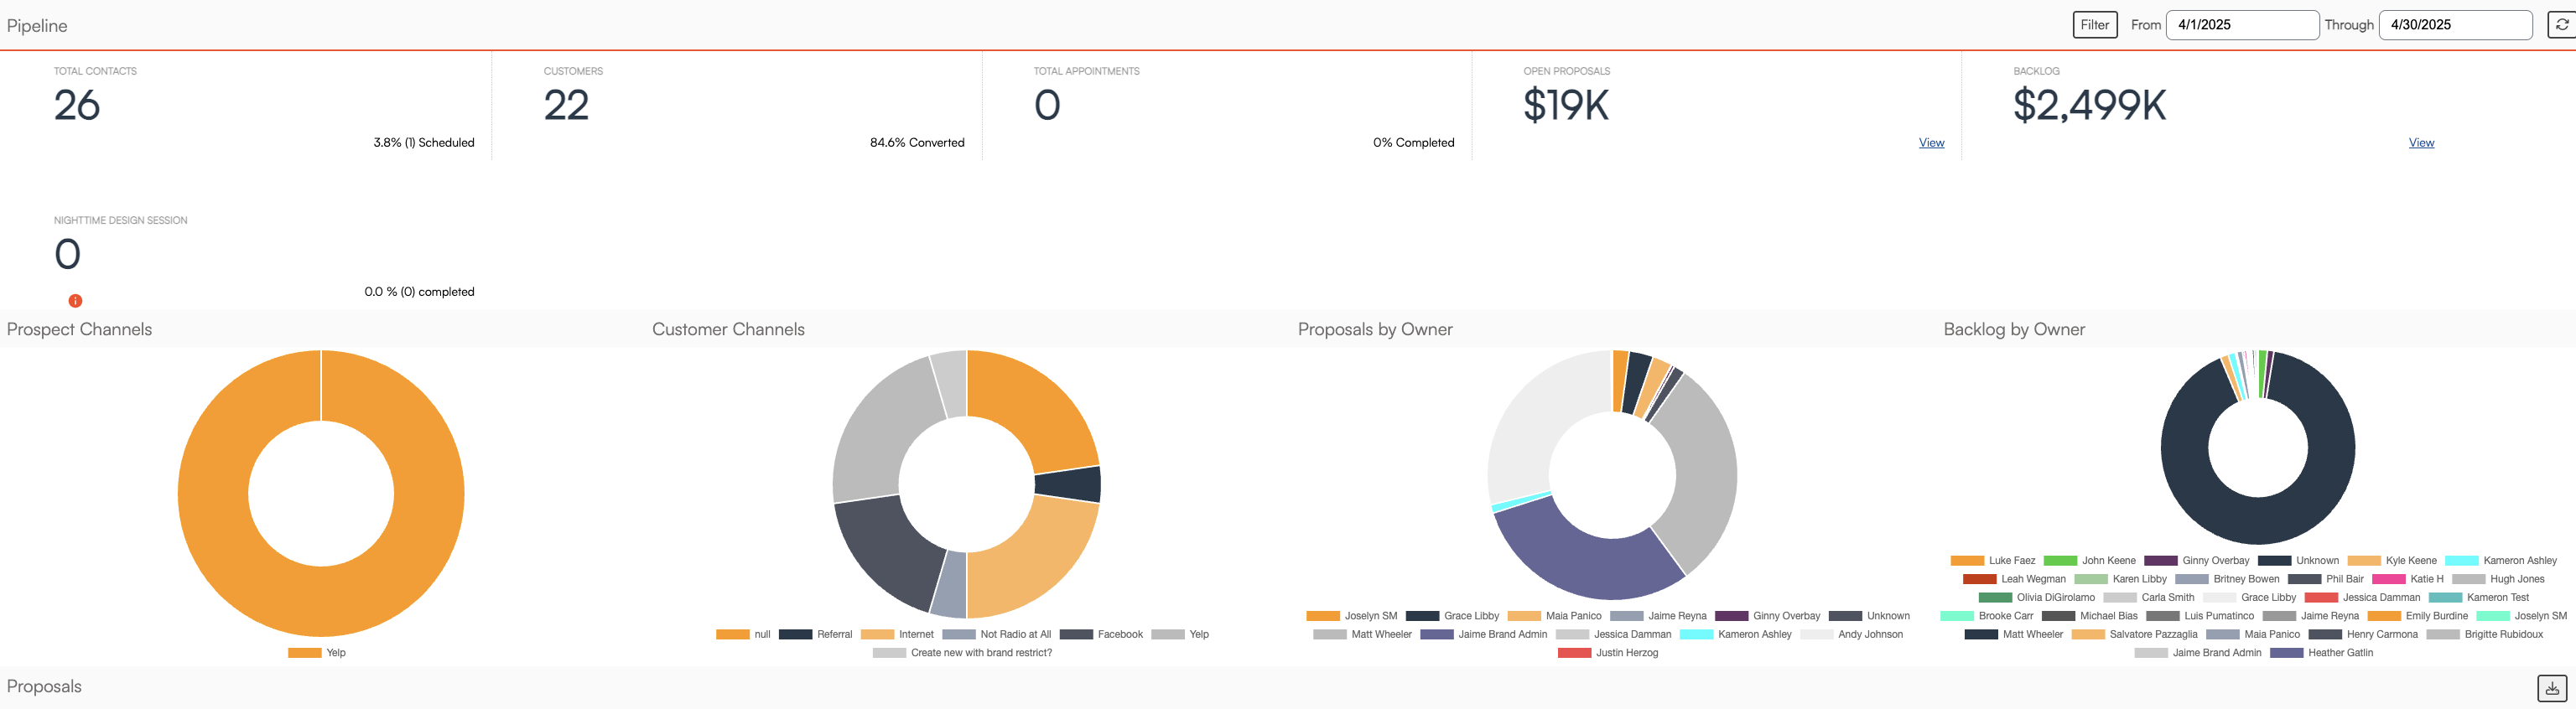 The Pipeline Report tracks and displays key metrics, including:
- Total Contacts: Number of new contacts added within the selected timeframe.
- Customers: Number and percentage of contacts converted to customers.
- Appointments: Number of appointments scheduled (not always directly correlated to contacts/customers, as one contact can have multiple appointments).
- Proposals: Number of proposals created, accepted, scheduled, invoiced, and declined, along with their values.
- Open Proposals: Value of proposals still pending decision.
- Backlog: Dollar value of appointments or jobs not yet completed.
- Conversion Rates: Percentage of contacts converted to customers, proposals accepted, etc.
- Channels: Visual charts showing the sources of prospects and customers (e.g., PPC, direct traffic, referrals).
- TaskBoards: Summary of contacts moved through each stage of your sales or service process.
Charts
By default, each org has two different charts related to Contacts.

- Contacts Created over Time - a bar graph showing contacts added to your account for a specific time period
- Contact Distribution by City - a bar graph showing where your contacts are located geographically
Downloads
By default, every org has two downloads that are related to Contacts in their account.

- Contacts - Pulls a list of all contacts within the organization and includes information like category and tags. This is a handy download if you are trying to get specific numbers on how many are Leads vs. Customers within a date range.
- Contact Notes - Pulls a list showing name, address, tags, date, and all notes made on that Contact Detail's page.
Other Contact Reporting Terms
On the Contacts Grid and on the Contact Details page, you can find several fields that some may want clarification on. Here are some of the most asked about:
- Balance - This is based on the sum of all invoices with balance due.
- Lifetime Value - Based on the sum of all invoices for that Contact, and does not include taxes; that will mean it is different than Invoice Total

FAQs
How do I pull a list of all the prospects from 2023 that did become customers?
Franchisees can pull this report in Reports > Downloads tab > Contacts. Then sorting based on Contact Category and a date range.
For Franchisors (Brand Admins) you can pull this same contacts download (from Dashboard > Downloads), which will pull in contacts from EVERY org. Filter using any created after 12/31/2022 through 12/31/2023 and sort the category column to Prospects. So there's a little manual work but you will get the most accurate count.
Do contacts labeled "Partner/Vendor" count towards the lead count?
Our system counts new leads as new contact entries. They count towards the total contacts in the system so who is "new" relative to a date range. The number listed is a hyperlink that will take you to the contact grid with only those contacts listed. From there you can filter on the category so "partners" are not included. But there is not a way to remove them from the actual Lead Source report.
