Overview
Main Information
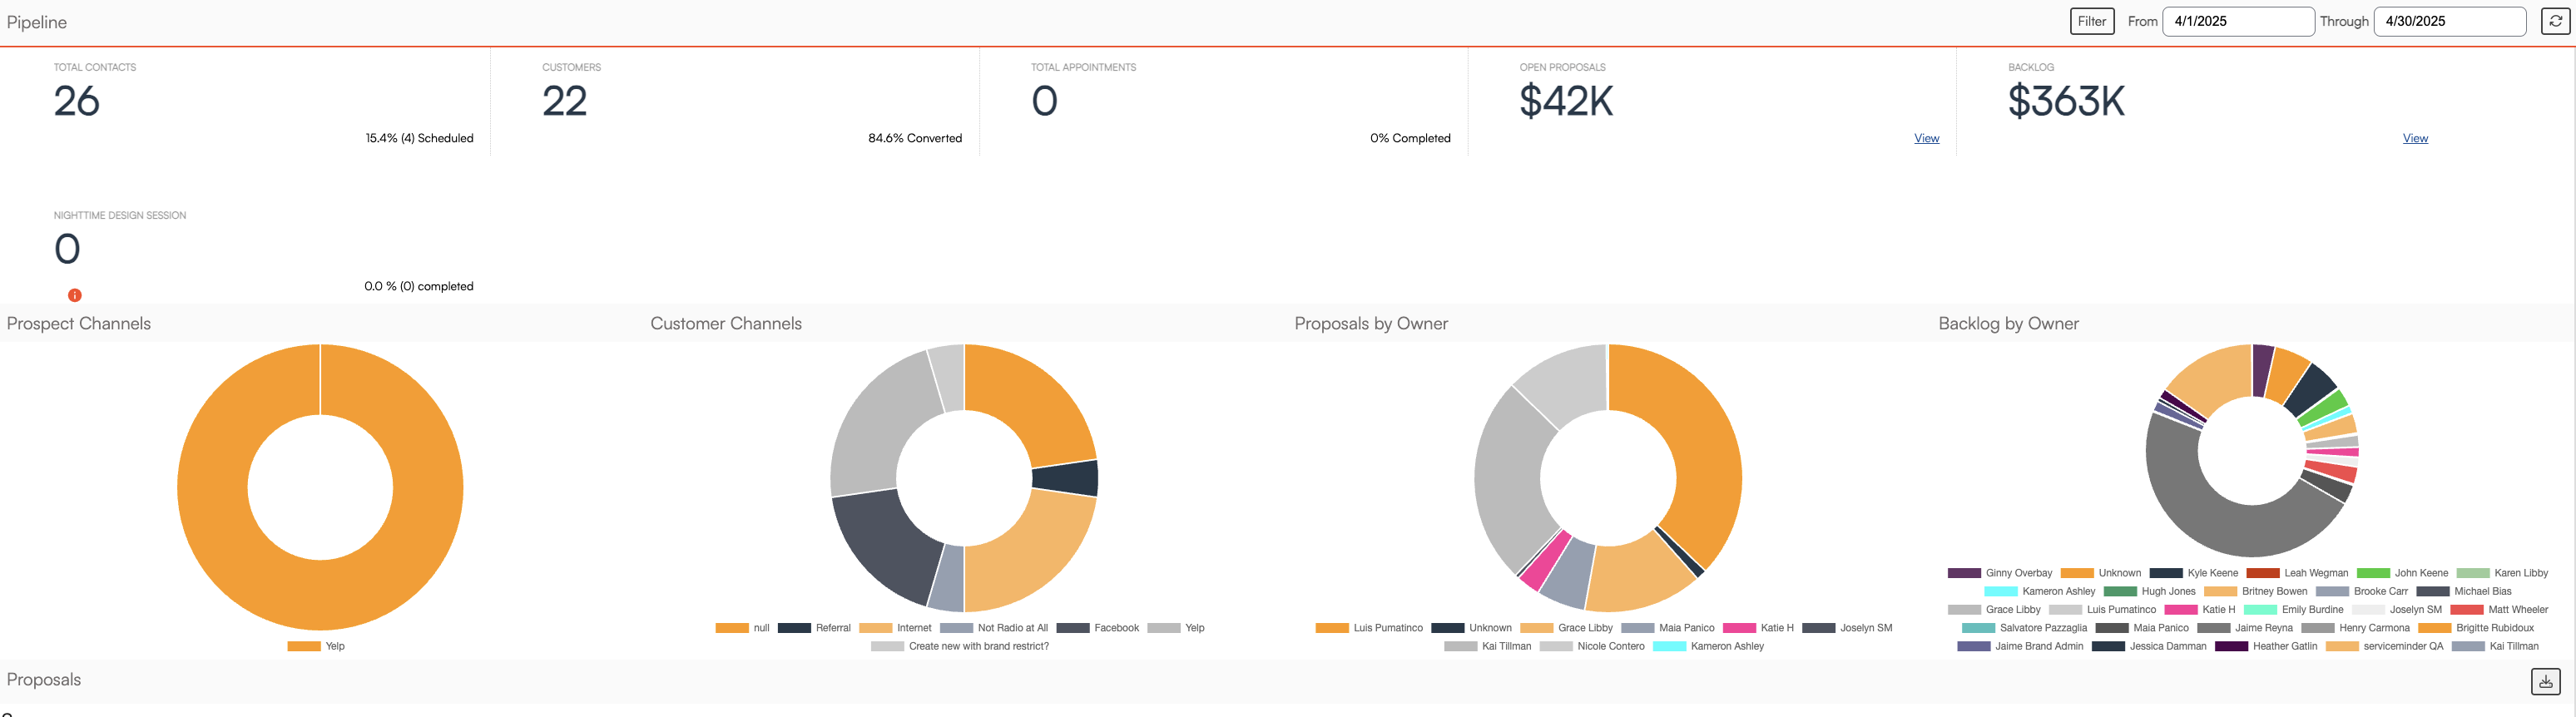
The top bar contains the fields for modifying the date range of the report as well as the Refresh button for updating the report to match the selected date range.
| Label | Description |
|---|---|
| Total Contacts | Number of Contacts added within selected time frame. |
| Customers | Number of Contacts that have become Customers. Percentage of Customers that have become Contacts in subtext. |
| Total Appointments | Number of Appointments scheduled for selected time frame. Percentage completed in subtext. |
| Open Proposals | Total value of open proposals in dollars. Subtext has link to Open Proposals. |
| Backlog | Total value of backlogged Appointments. Subtext has link to Backlog. |
| Proposal Generating Services (variable) | Each Service with a Service Role set to Generate Proposal upon finish will have a counter generated for the total number of Appointments scheduled within the date range. The subtext displays the percentage and quantity of these Appointments that have been completed. |
Tip
Hover over the titles of the top section will give you more information about what each section is calculating.

Hovering over the pie chart sections will reveal the details such as number of leads or dollar values.

| Label | Description |
|---|---|
| Prospect Channels | Displays the number of contacts added within the timeframe and divides them by channel. |
| Customer Channels | Displays the number of contacts added in the customer category within the timeframe and divides them by channel. |
| Proposals by Owner | Displays the value of proposals divided by owner. |
| Backlog by Owner | Displays the value of backlogged appointments divided by owner. |
Proposals
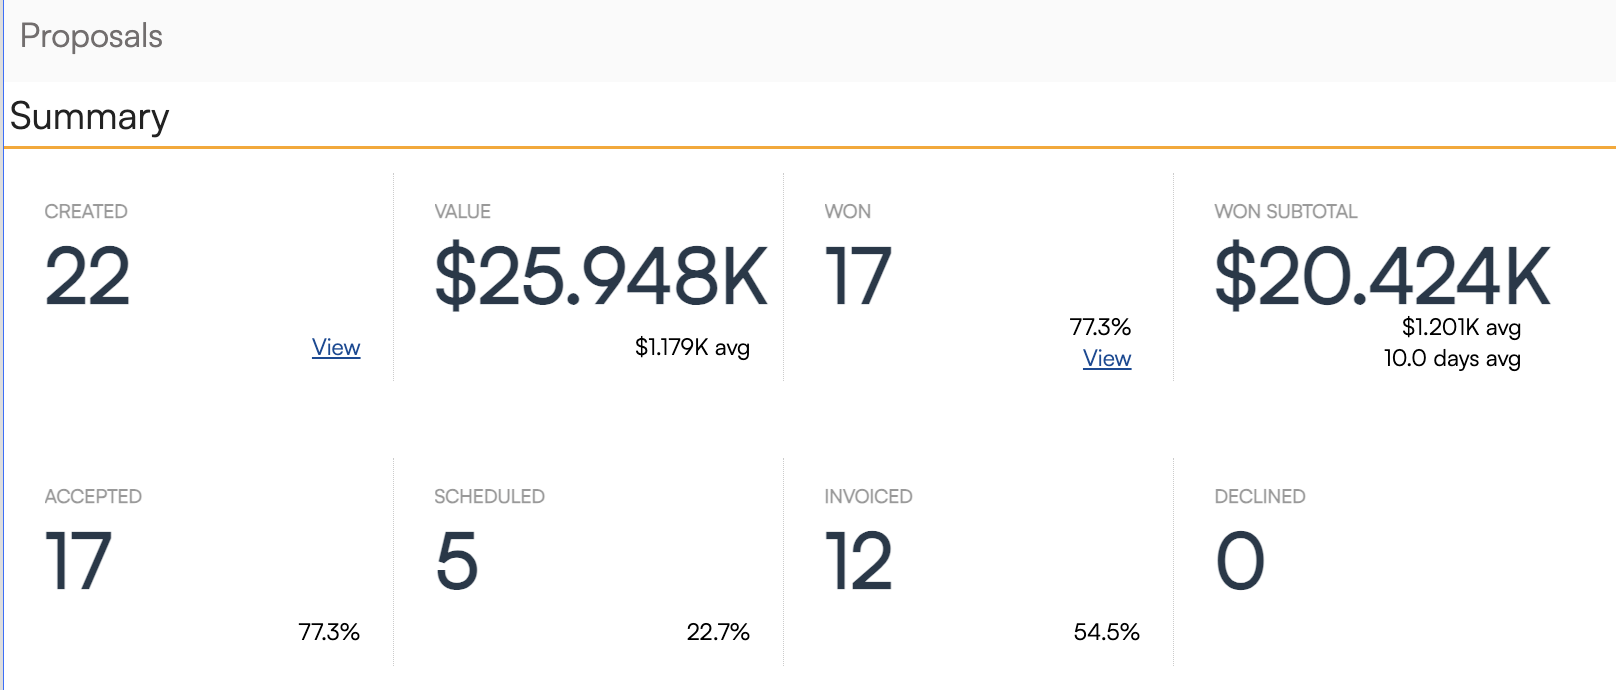
Proposal information is displayed in total and the following sub-sections break it down by owner of the proposal.
| Label | Description |
|---|---|
| Created | Number of Proposals created. |
| Value | Total value of all Proposals. |
| Won | Total of all proposals that are completed, invoiced, scheduled, and accepted. |
| Revenue | Total value of all invoiced Proposals |
| Accepted | Number of accepted Proposals. Subtext contains percentage of Proposals accepted. |
| Scheduled | Number of scheduled Proposals. Subtext contains percentage of Proposals scheduled. |
| Invoiced | Number of invoiced Proposals. Subtext contains percentage of Proposals invoiced. |
| Declined | Number of declined Proposals. Subtext contains percentage of Proposals declined. |
Everything from Proposal section and down is able to be downloaded. Look for the download icon in the far right of the Proposal section header.

Taskboard Tracker
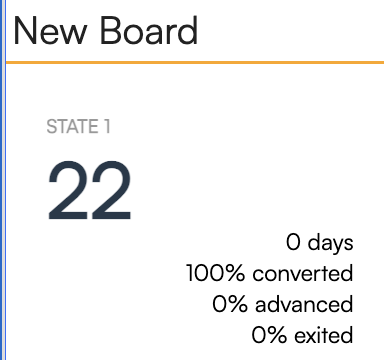
To learn more about TaskBoards, visit this help page.
FAQs
If I create a proposal one week and it's accepted the next week, when will it show as "Won"?
The proposal will show as Won in the filtered date range when it was created. So if you filter on this week, it won't show as Won this week; if you change it to last week, when it's created date falls, then it would show as Won.
How are the numbers of prospect contacts and total contacts not adding up?
Say you have 30 Total Contacts and 22 in Prospect Channel (the circle graph below that category). The Prospect Channels chart shows 22 because out of the 30 Total Contacts above, 8 were converted to Customers.
Once a contact is converted into a customer, they're no longer going to be considered a prospect.
Why don't the Contacts and Appointments directly correlate?
For the Contacts and Customers, that is directly related. As an example, you have 10 new contacts and 5 became customers.
The appointments are a little different, they're based on the number of appointments scheduled in that date range that have a finish action of Generate Proposal. Using the example image above, the Estimate Appointment is one of those services. If it says 6 estimates were scheduled and 50% were completed, which probably means some were cancelled or weren't completed in the time frame that the report is set to look at.
So the appointments don't directly correlate to the Contacts/Customers numbers there.
In the total contacts section, can you explain how someone would have more scheduled appointments then contacts that came in?
It's going to count all the appointments the contact has, not just the first appointment.
Can you clarify what the difference is between Won Proposals and Revenue?
Won Revenue is all accepted proposals regardless of invoices or payments received. Invoice Revenue refers to invoices created regardless of payments received to those invoices.
