Overview
This page discusses built-in reporting specifically for proposals. If these reports do not include the information for strategic initiatives for specific KPIs, we do offer ways of exporting data outside of serviceminder to data analysis tools such as Domo or a Tableau.
Franchisees can access only reports for their organization. They will go to Reports in the navigation menu.

Brand Administrators can access brand-level reports in Dashboard > Reports tab. From this reporting hub, brand reports pull data from all active organizations.

Open Proposals/Options Report
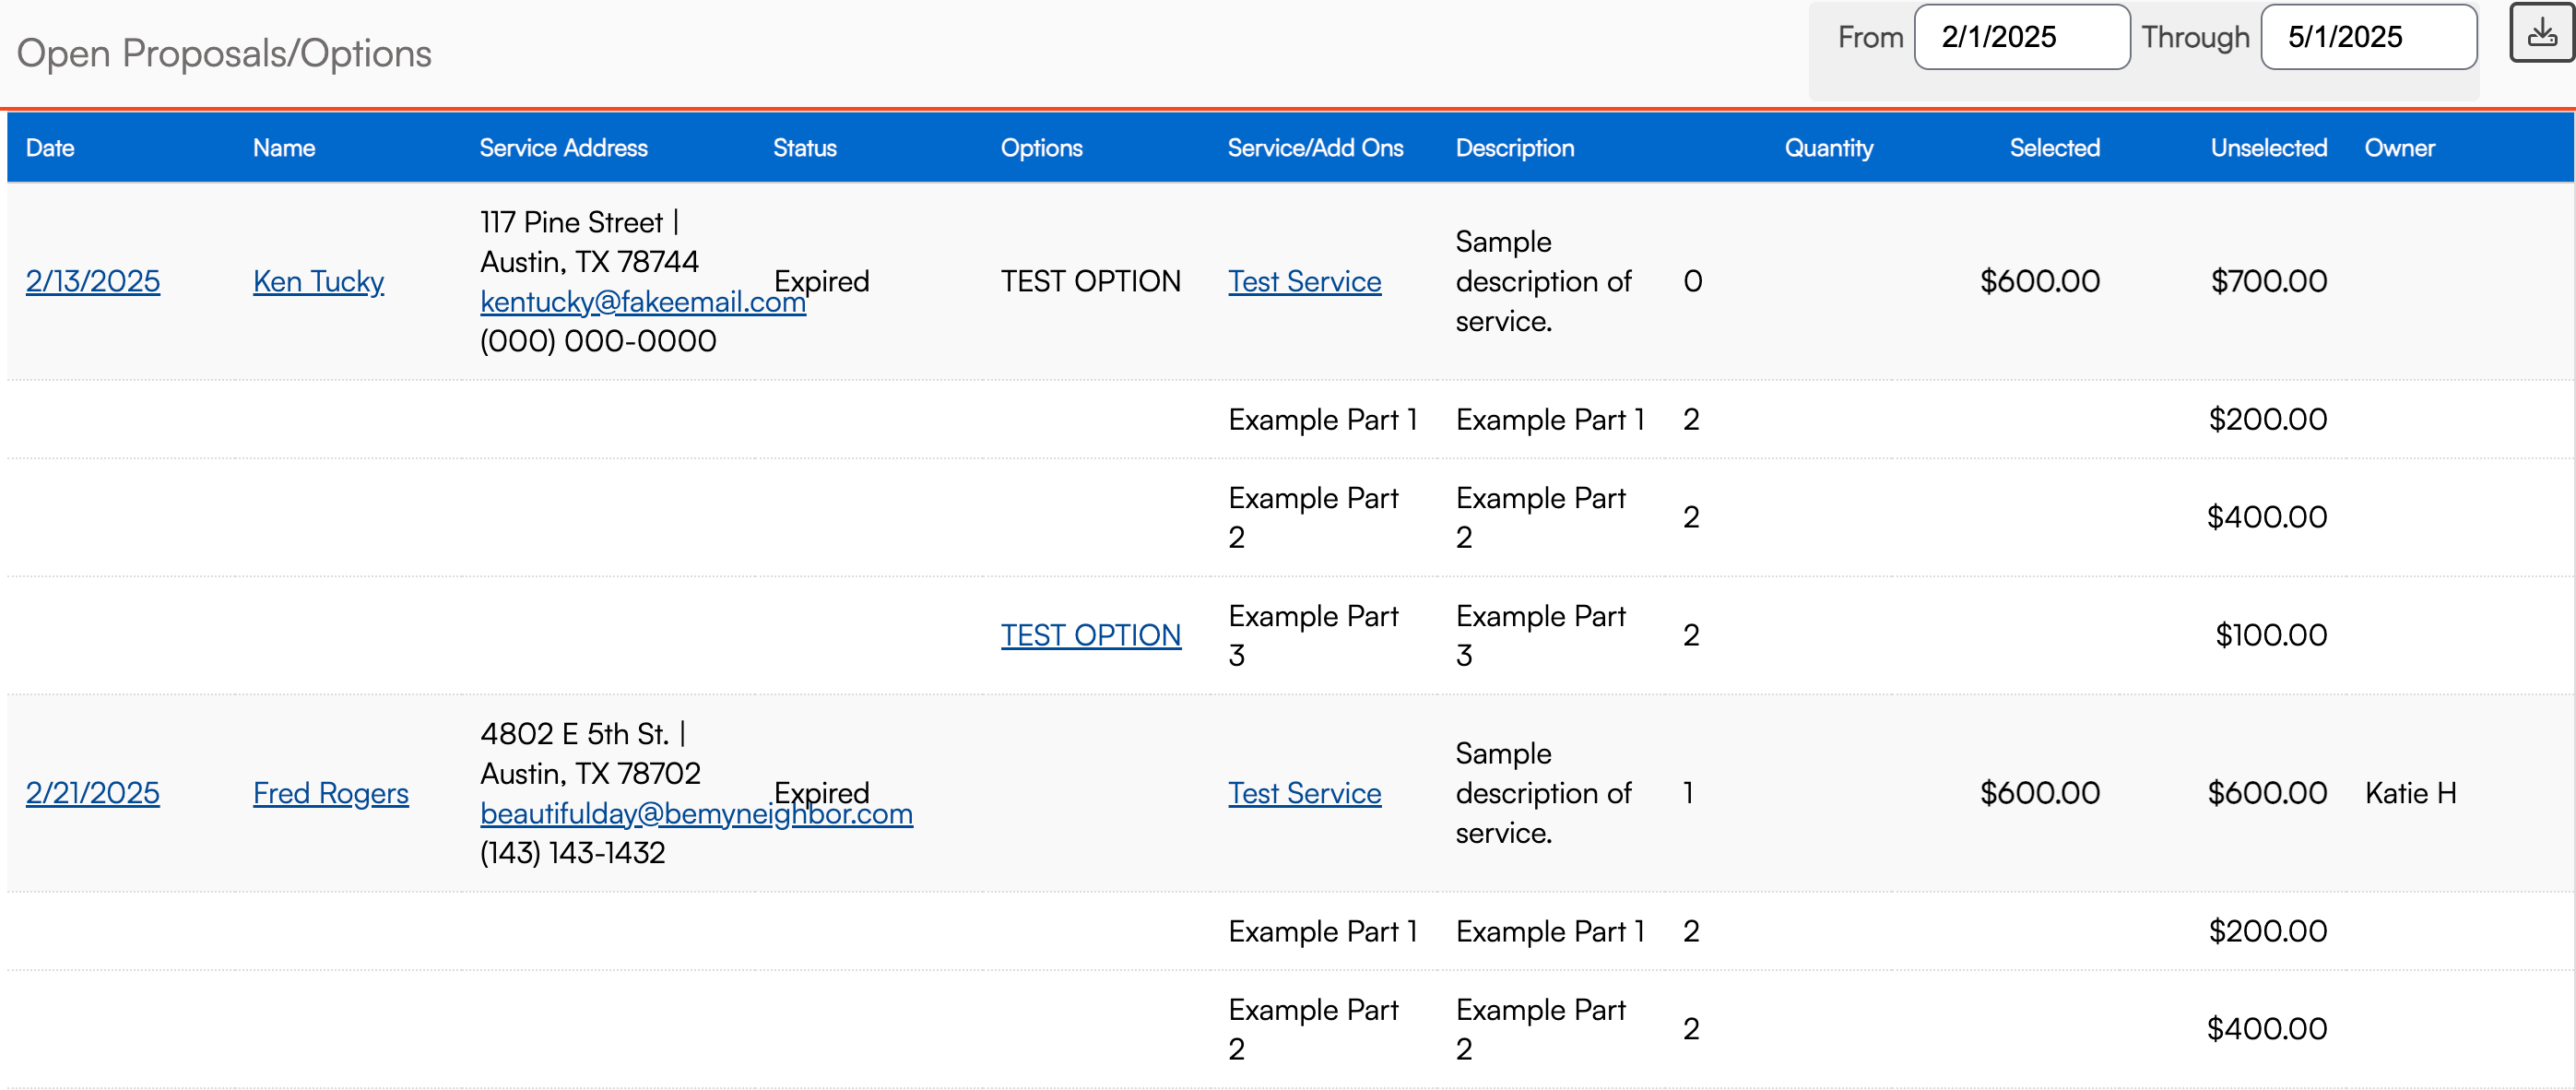
The Open Proposals/Options report provides a summary of all proposals and options that have not been accepted or selected. This report helps track proposals that are still in the decision-making phase and allows filtering by the date of the proposal.
This report includes:
- Date of Proposal: The date when the proposal was created.
- Contact Name and Service Address: Information about the contact and the service location.
- Status: The current status of the proposal (e.g., open, expired).
- Options: The name of the option(s) on the proposal that have not been accepted.
- Service Name and Description: The name of the service line, including any parts or add-ons, and the description of each.
- Quantity: The quantity of the service line and any parts or add-ons.
- Selected/Unselected: Columns indicating the dollar value of the options that have been selected or remain unselected.
- Owner: The name of the user that is the owner of the proposal.
Proposal Declines Report
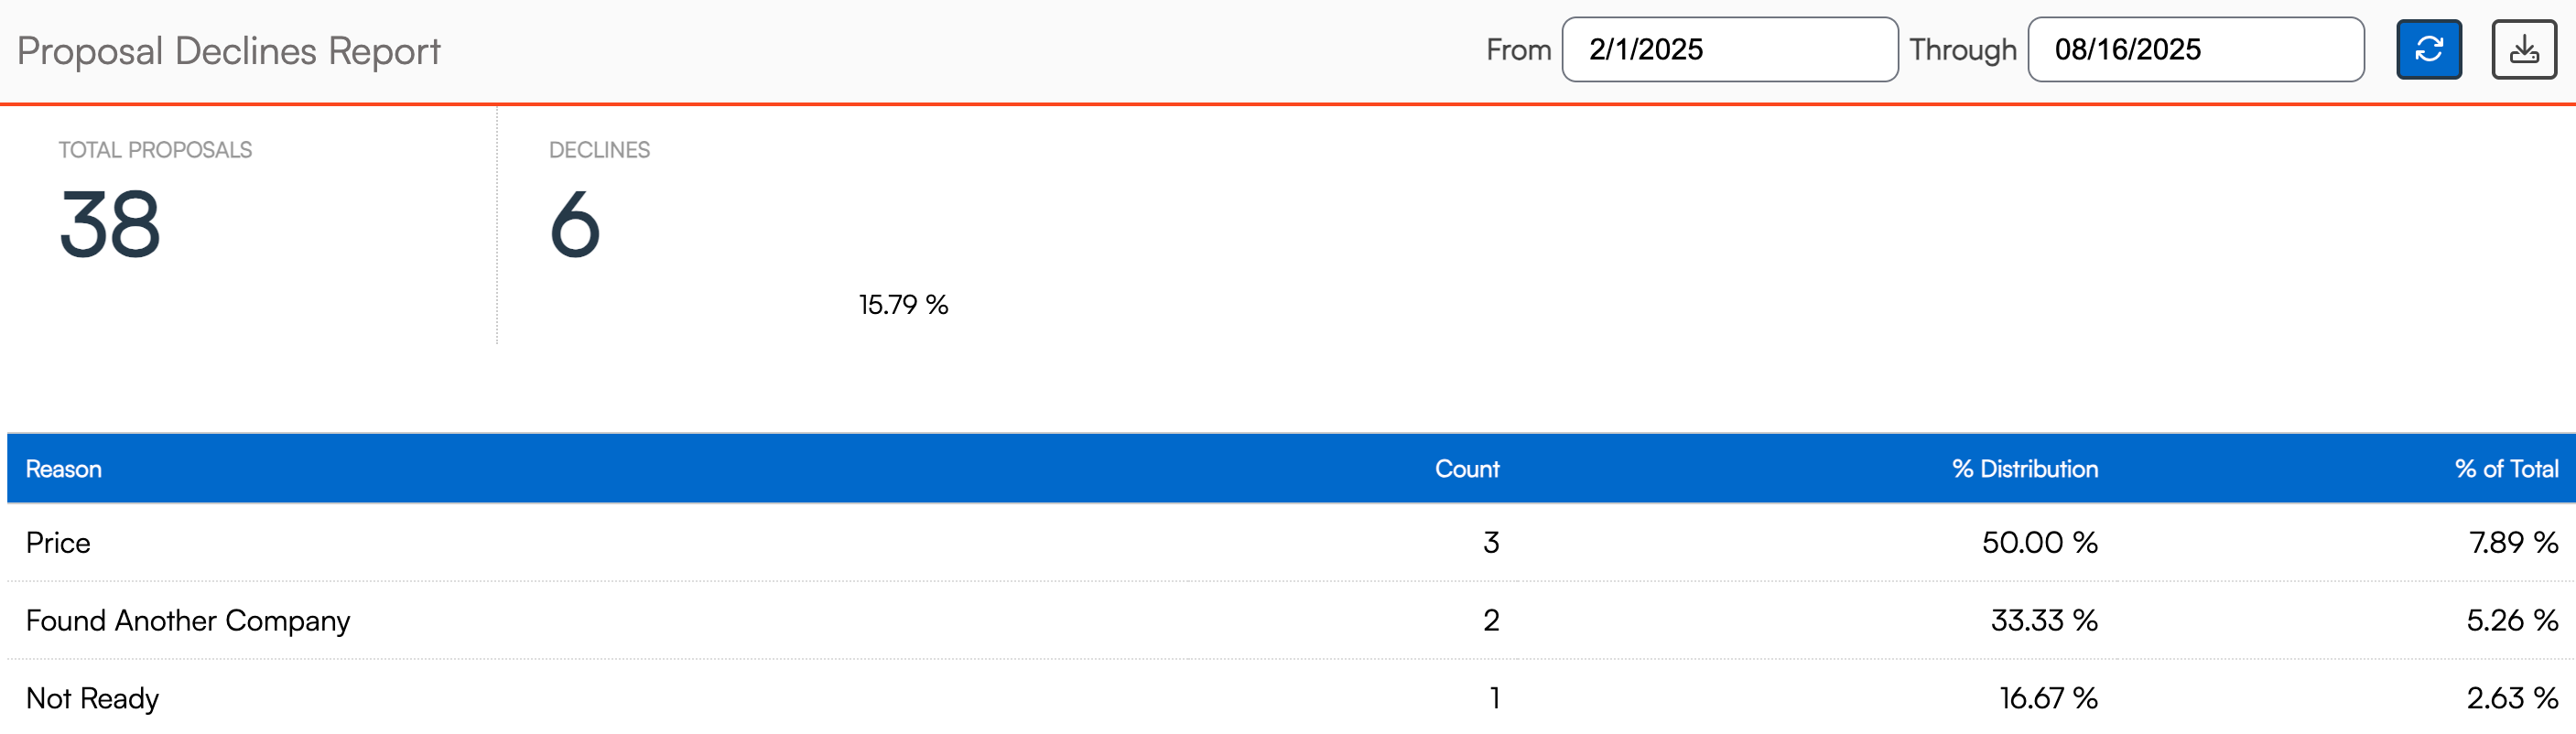
The Proposal Declines report provides a count of proposals that were created within a set date range and the number of proposals that were declined. This report helps identify common reasons for proposal declines and allows for better understanding and addressing of client objections.
This report includes:
- Count of Total Proposals: The number of proposals created within the set date range.
- Count of Declines: The number of declined proposals that were created within the set date range.
- Decline Percentage: The percentage of created proposals within the set date range that were declined.
- Declines grouped by Reason
- Count: How many proposals were declined with that reason.
- % Distribution: What percentage of declined proposals were for that reason.
- % of Total: What percentage of all proposals were declined for that reason.
You can configure Proposal Decline Reasons in Control Panel > Proposals.
Proposal Pivot Grid Report
The Proposal Pivot Grid is a dynamic report that allows for interactive analysis, filtering, and grouping of data. It is especially helpful for identifying trends and comparing key business metrics.
This report includes:
- Filter Header Area: Drag field headers to control how data is grouped into rows or columns.
- Column Header Area: Defines the columns of the grid.
- Row Header Area: Determines how data is grouped by rows.
- Data Header Area: Contains summarized values such as totals or counts.
Visit the Pivot Grid help page for more detailed instructions on using this feature.
Proposal Summary Report
The Proposal Summary Report summarizes proposals (estimates, work orders, quotes) by various statuses such as created, accepted, invoiced, booked, scheduled, and declined. Data is grouped by proposal owner, but you can also filter and group by other fields like date, service, or status. It is a useful tool for monitoring proposal activity, sales performance, and financial metrics. It helps you understand your sales pipeline, track team and individual performance, and make informed business decisions.
This report shows all Proposals created, accepted, invoiced, booked, and scheduled for a given date range. You can adjust the date range or filter based on additional criteria.
This report includes:
- Count of Proposals: The number of proposals.
- Subtotal Value: The total value of the proposals.
- Average Dollar Value: The average value of the proposals.
- Margins: The profit margins as a percentage.
These statistics are broken apart by the status of the proposals (created, accepted, invoiced, booked, scheduled, declined).
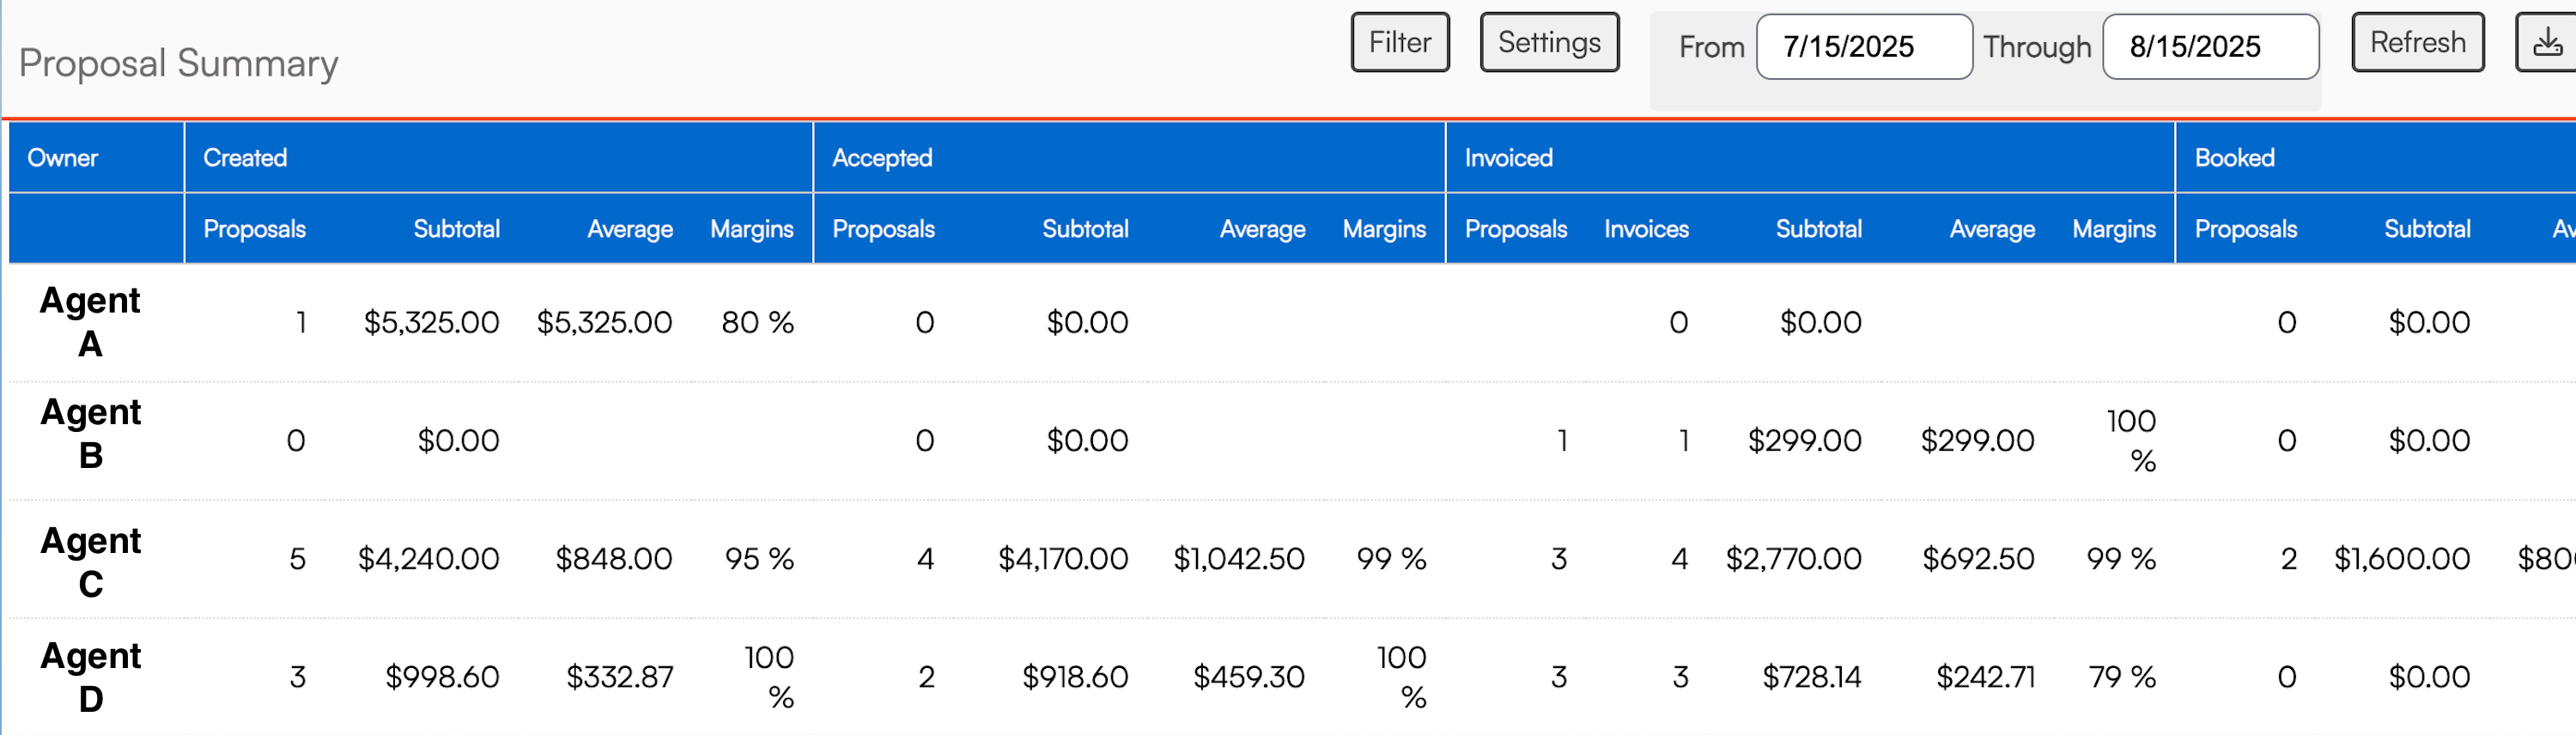
The data is independent because the columns don't reflect numbers that are related to the other columns - they are only showing the numbers of that type for that date range, nothing else. For instance, the number of proposals invoiced for that time frame is totally separate from the number of created proposals for that timeframe.
Example: You've set your date range for last week. Proposals Created shows 3 for the week, but Proposals Accepted shows 5. This is because the accepted proposals could've been created two weeks ago, last month, or six months ago.
Report Terminology
- Date From/Through - The date range for when the proposal(s) were approved
- Created After/Through - The date range the proposal(s) were created
- Updated After/Through - The date range of the proposal(s) most recent update
- Completed After/Through - The date range for when the proposal(s) were marked as completed
- Booked -refers to all proposals that have been accepted by have not been scheduled yet (these include queued appointments)
- Scheduled -refers to proposals that have been both accepted and are confirmed on the schedule
- Invoiced - proposals invoiced in the time frame
- Declined - proposals declined within the time frame
FAQs
Q: On the Proposal Close Rates report, what appointments are tracked in the "Scheduled" column?
A: That column tracks appointments that are scheduled through the proposal. More specifically, it is tying to appointments scheduled through the proposal screen and using the “Schedule” button there.
Q: What if we schedule appointments not from proposals? How do we track that?
A: One option is to use the appointments download, select scheduled and a time frame (or leave it blank to get all that are in the scheduled status). This would capture all of the appointments as opposed to just the one's scheduled through the proposal.
To learn more about Appointment Reporting, please review this help page.
Q: Do change orders count as separate proposals in the Proposal Summary and Proposal Closing Rate reports?
A: Proposal Summary and Proposal Close Rates do not count a change order as a separate proposal. They are looked at as addendums to the root proposal. In the example described, this would be reported as 1 accepted proposal.
Please see this additional article of you would like to learn more about Change Orders.
Q: Do Proposal Summary and Proposal Close Rates reports use the same underlying data, e.g., Accepted Date?
A: These two reports are based on different date filters. Proposal Close Rate is based on created at date and is a brand-level report. Proposal Summary is an org-level report, and the accepted column is based on accepted date of the proposals.
Q: What is the difference between Proposal Summary and Pipeline report in regards to won or accepted proposals? I've noted inconsistencies.
A: The Proposal Summary report is based on actions in that timeframe. This is reporting how many proposals have an accepted date for your chosen date range. However, the Pipeline report is referencing proposals dated that month.
The two reports are filtering on different dates, Pipeline = Proposal Date while Proposal Summary for the Accepted column = Accepted Date.
If you would like to learn more, please review the page about Pipeline Report.
